Financial Performance
FINANCIAL PERFORMANCE
The Financial Results for the FY 2020-21 reflect that our Company has registered a negative Growth Rate of -8.92 % on gross basis and underwritten Global Premium of Rs. 12747.42crores as against Rs. 13996.01crores in the year 2019-20. Our net premium was Rs. 11007crores in the year 2020-21 in comparison to Rs. 10988.69crores in the year 2019-20, registering a growth of 0.16%.

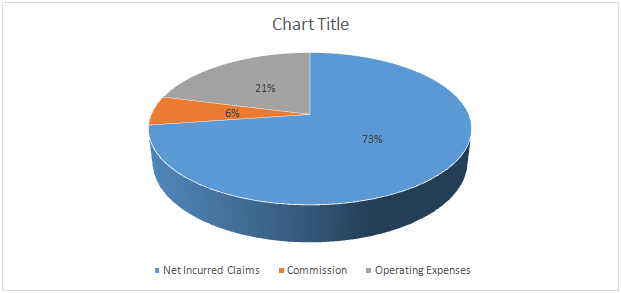
The Operating Deficit, after taking into account the Policyholder’s income, amounted to Rs. 1232.82crores in the FY 2020-21 , as compared to a defict of Rs. 1382.75crores in 2019-20, mainly on account of Incurred Claims.
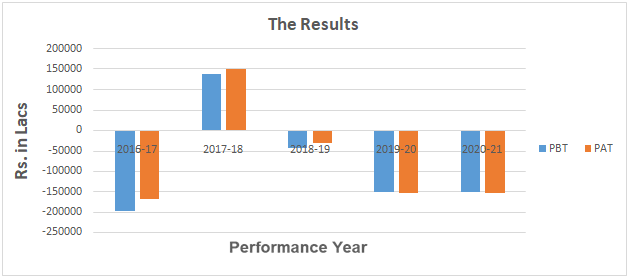
This year, we recorded a loss before tax of Rs. 1512.05crores as compared to a loss of Rs. 1498.69crores in the last year as all the liabilities were accounted as per best actuarial estimates in the FY 2020-21 and the Company had no carryover of previous liabilities. We ended up with a loss after tax of Rs. 1525.44crores in the FY 2020-21 as compared to a loss of Rs. 1524.10crores in the year 2019-20.

The Operating Expenses during the year 2020-21 amounted to Rs. 3042.81crores as compared to Rs. 3442.53crores in the year 2019-20 thus resulting in a decrease of Rs. 399.72crores.

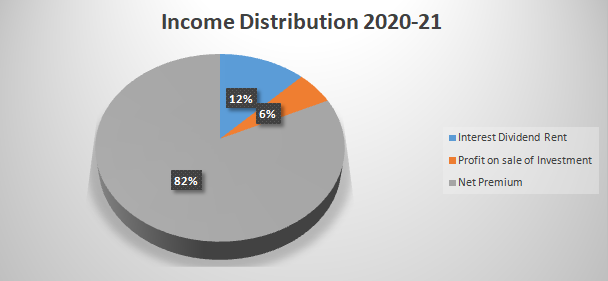
Profit on Sale of Investments was Rs. 749.98crores in the year 2020-21 , as compared to Rs. 1740.71crores in the year 2019-20 whereas Income from Interest, Dividend & Rent was recorded as Rs. 1660.33crores during the current year in comparison to previous year’s figure of Rs. 1438.05crores.

Our Foreign Operations of Nepal, Dubai, Kuwait & Qatar registered a Gross Premium of Rs. 297.71crores and a net surplus of Rs. 141.61crores in 2020-21 as against a Gross Premium of Rs. 323.36crores and a net deficit of Rs. 62.46crores in the year 2019-20.
The Solvency margin as on 31.3.2021 stood at 1.52.
The world renowned rating agency, AM BEST has also maintained our rating at “B++” (very good). We continue being consistently given the highest rating by CRISIL and ICRA also.
- Financial Performance of the Company
(Rs. in lakhs)
| Fire | Marine | Miscellaneous | Total | ||||||
| 2020-21 | 2019-20 | 2020-21 | 2019-20 | 2020-21 | 2019-20 | 2020-21 | 2019-20 | ||
| Gross Direct Premium: In India | 165051 | 133310 | 34038 | 36232 | 1045882 | 1197723 | 1244971 | 1367265 | |
| Outside India | 7994 | 7878 | 2140 | 2335 | 19639 | 22123 | 29771 | 32336 | |
| Gross Direct Premium Total | 173045 | 141188 | 36178 | 38567 | 1065519 | 1219846 | 1274742 | 1399601 | |
| Net Premium | 74954 | 72222 | 19898 | 20619 | 1005883 | 1006028 | 1100735 | 1098869 | |
| Ratio of Net to Gross | 43.31 % | 51.15 % | 55.00 % | 53.46 % | 94.40 % | 82.47 % | 86.35 % | 78.51% | |
| Profit on Sale of Investments (Policy Holders’) | 5111 (6.82%) | 13685 (18.95%) | 1243 (6.25%) | 3138 (15.22%) | 66635 (6.62%) | 1555443 (15.45%) | 72989 (6.63%) | 172266 (15.68%) | |
| Int./Div./ Rent (Policy Holders’) | 11314 (15.09%) | 11306 (15.65%) | 2753 (13.83%) | 2592 (12.57%) | 147517 (14.67%) | 128416 (12.76%) | 161584 (14.68%) | 142314 (12.95%) | |
| Commission and other income (Net Income(+)/ Net Outgo (-)) | -11458 (-15.29%) | -11585 (-16.04%) | -2119 (-10.65%) | -2156 (-10.46%) | -76807 | -68066 (-6.76%) | -90384 (-821%) | -81807 (-7.45%) | |
| NPA (Provision (-)/ Write back(+)) | -266 (-0.35%) | -2212 (3.06%) | -65 (-0.33%) | -507 (-2.46%) | -3471 (-0.35%) | -25124 (-2.50%) | -3802 (-0.35%) | -27843 (-2.53%) | |
| Diminution in value of shares (-)/ written back (+) | -15 (-0.02%) | 68 (0.09%) | -4 (-0.02%) | 15 (0.07%) | -196 (-0.02%) | 770 (0.08%) | -215 (-0.02%) | 853 (0.08%) | |
| Increase (-)/ Decrease (+) in unexpired risks reserve | -1366 (-1.82%) | -5135 (-7.11%) | 394 (1.98%) | -874 (-4.24%) | -3935 (-0.39%) | -416 (-0.04%) | -2963 (-2.27%) | -6425 (-0.58%) | |
| Net Incurred claims | -39469 (-52.66%) | -53368 (-73.89%) | -15625 (-78.52%) | -19141 (-92.83%) | -997075 (-99.12%) | -1045453 (-103.92%) | -1052169 (-95.59%) | -1117962 (-101.74%) | |
| Expenses of Management(Net of contribution from Shareholder’s Fund) | -34016 (-45.38%) | -28078 (-38.88%) | -3231 (-16.24%) | -3437 (-16.67%) | -240957 (-23.95 %) | -284475 (-28.28%) | -278204 (-25.27 %) | -315990 (-28.76%) | |
| Amortization expenses | -341 (-0.45%) | -294 (-0.41%) | -83 (-0.42%) | -67 (-0.32%) | -4444 (-0.44%) | -3342 (-0.33%) | -4868 (-0.44%) | -3703 (-0.34%) | |
| Investment Written off/ Expenses relating to Investments | -134 (-0.18%) | -195 (-0.27%) | -32 (-0.16%) | -45 (-0.22%) | -1724 (-0.17%) | -2216 (-0.22%) | -1888 (-0.17%) | -2456 (-0.22%) | |
| Premium Deficiency | 0 | 3610 (5.00%) | 0 | 0 | -30023 (-2.98%) | 0 | -30023 (-2.72%) | -3610 (-0.33%) | |
| Net Operating Profit /(Loss) | 4316 6.76% | 24 (0.03%) | 3129 15.72% | 137 0.66% | -130727 (-12.99%) | 0 | -123282 (-11.19%) | -138274 (-12.58%) | |
| Interest, Dividends & Rent (Shareholders’) | 4449 | 1491 | |||||||
| Profit on sale of Investments (Shareholders’) | 2010 | 1804 | |||||||
| Other Income/ Outgo/Provisions(other than taxation) | -1441 | 16080 | |||||||
| Contribution from Shareholder’s Fund to Policyholder’s Funds towards EoM | -26076 | -28263 | |||||||
| Interest accrued on NCD and NCD & Rights Issue expenses | -6723 | -6674 | |||||||
| CSR Expenditure | -1068 | -87 | |||||||
| Prior period Income / Expenses | 926 | 4054 | |||||||
| Profit (+) / Loss (-) before Tax | -151205 | -149869 | |||||||
| IT deducted at source and Provision for Tax | -883 | 0 | |||||||
| Provision for Tax for earlier years | 456 | -2541 | |||||||
| Net Profit/ Loss after Tax | 152544 | -152410 | |||||||
| Transfer to General Reserve / Contingency Reserve | -152544 | -152410 | |||||||
| Provision for Dividend | 0 | 0 | |||||||
| Corporate Dividend Tax | 0 | 0 | |||||||
Percentages mentioned above are to Net Premium


